Lecture on (micro)tomography
20 Dec 2019
Today, I gave a lecture on (micro)tomography, in front of a bunch of students from the University of Bern, as part of the Lecture Series on Advanced Microscopy. I tried to show them what can be nicely done with - for example - our desktop micro-CT scanners. The whole presentation was crafted in LaTeX and is available on GitHub, should you be interested in it. The student handout of the presentation was automatically compiled and put online using a GitHub Action (this one here), you can download a copy of the handout here if you like.
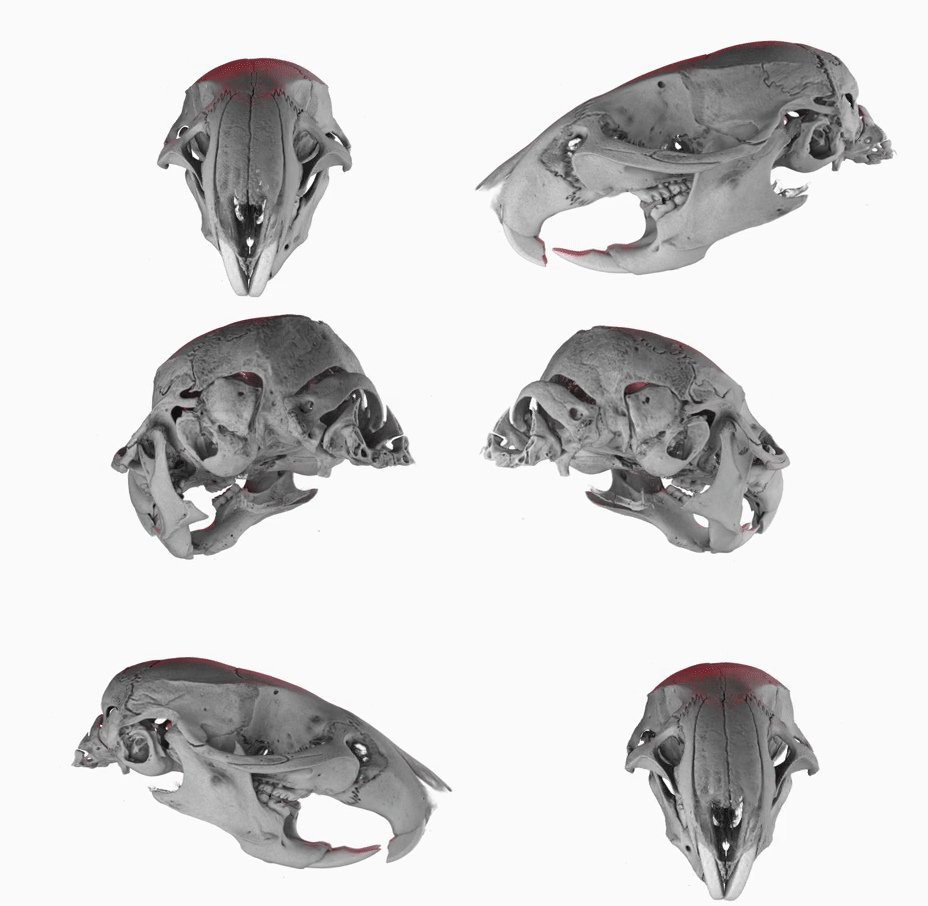
The poster image of this blog post shows a three-dimensional visualization of a mouse skull which is approximately 25 mm long from the nose to the back of the skull. The mouse head was scanned on a SkyScan 1172 with a source voltage of 59 kV, a source current of 167 µA with camera and geometry settings leading to an isotropic voxel size of 7.96 µm. The whole scan took about 74 minutes. I used the data set throughout the lecture to show different details and intricacies of the tomographic imaging process.
The data set was visualized in MeVisLab with the MeVis Path Tracer feature. The movie was generated from a set of single frames in the same manner as described previously.